Colour rendering
How naturally colours and materials appear.

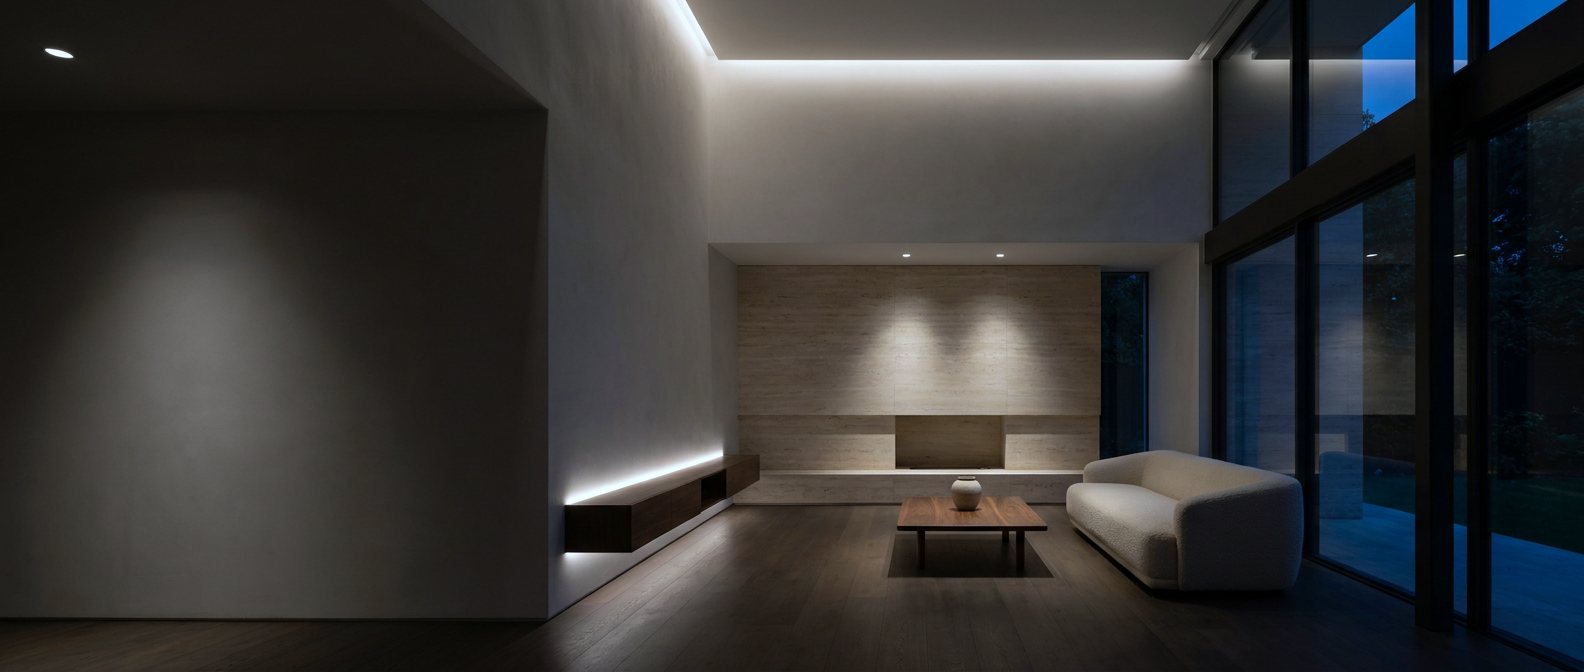
Better lighting isn’t about reaching higher numbers. It’s about creating the right light for every moment.
Explore the lightEspecially when the light gets warmer.
At very warm colour temperatures, a small numerical step can noticeably change the mood of a room. 1800 K has a deeper, amber-like character. 2000 K is still beautifully warm, with a slightly lighter, more golden feel.
mired: the step from 1800 K to 2000 K.
On the mired scale (one million divided by the kelvin value), the same 56-mired step starting from 4000 K would reach roughly 5150 K. Mired is a convenient way to compare colour-temperature steps, but it is not a perceptually uniform scale: equal steps do not necessarily look equally different.7
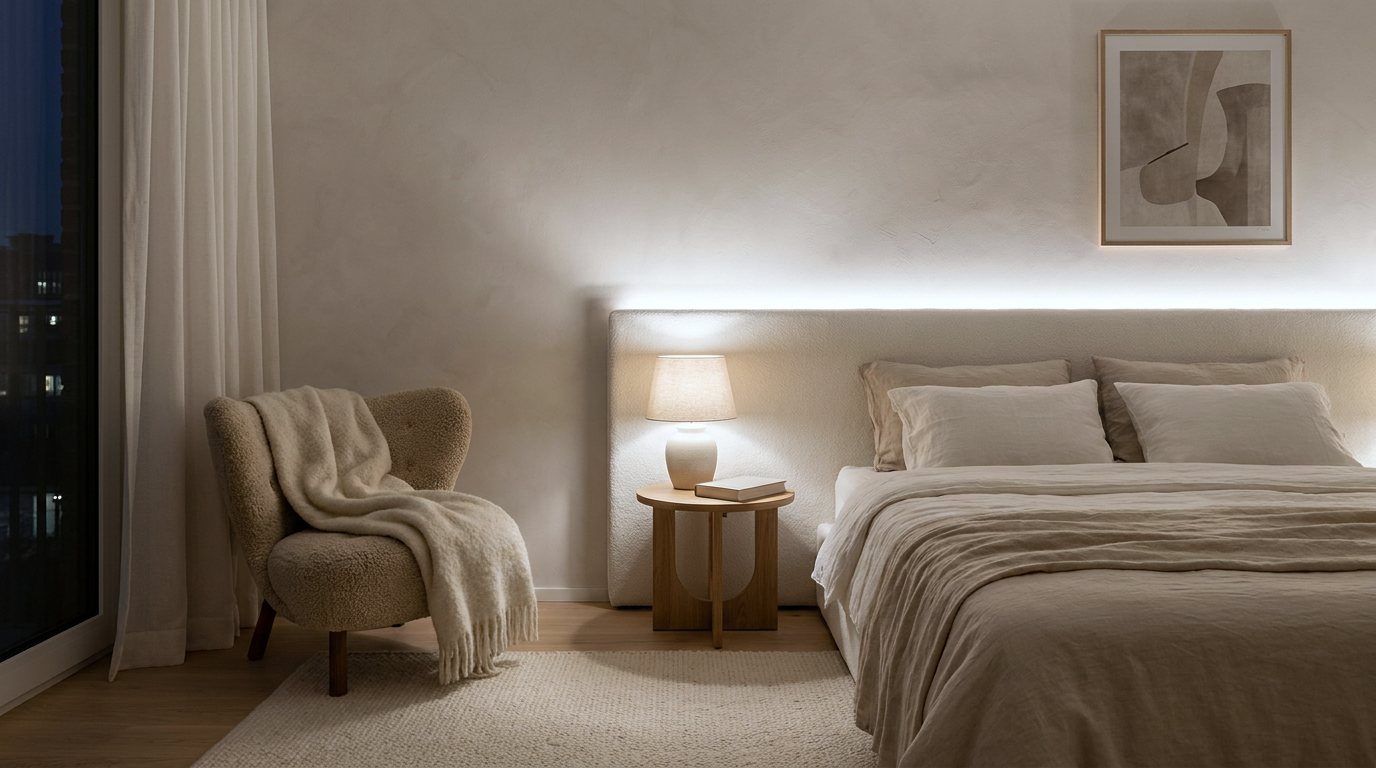 1800 K
2000 K
Drag the divider, tap the buttons or use the arrow keys. Illustrative visualisation: one AI-generated image shown under two modelled white points. On-screen colour depends on your display and cannot reproduce the spectrum of real light, so the real difference between two luminaires is best judged in person.
Tolerance standards such as ANSI C78.377 define nominal correlated colour temperature (CCT) categories through chromaticity coordinates rather than through fixed kelvin steps.5
CCT alone does not fully describe the colour of white light. Two sources with the same CCT can sit above or below the blackbody (Planckian) locus, expressed as Duv, and look slightly greenish or pinkish.6 The visible difference between two real products can only be established by measurement and direct comparison.
Light shapes more than the atmosphere. Its spectrum also matters.
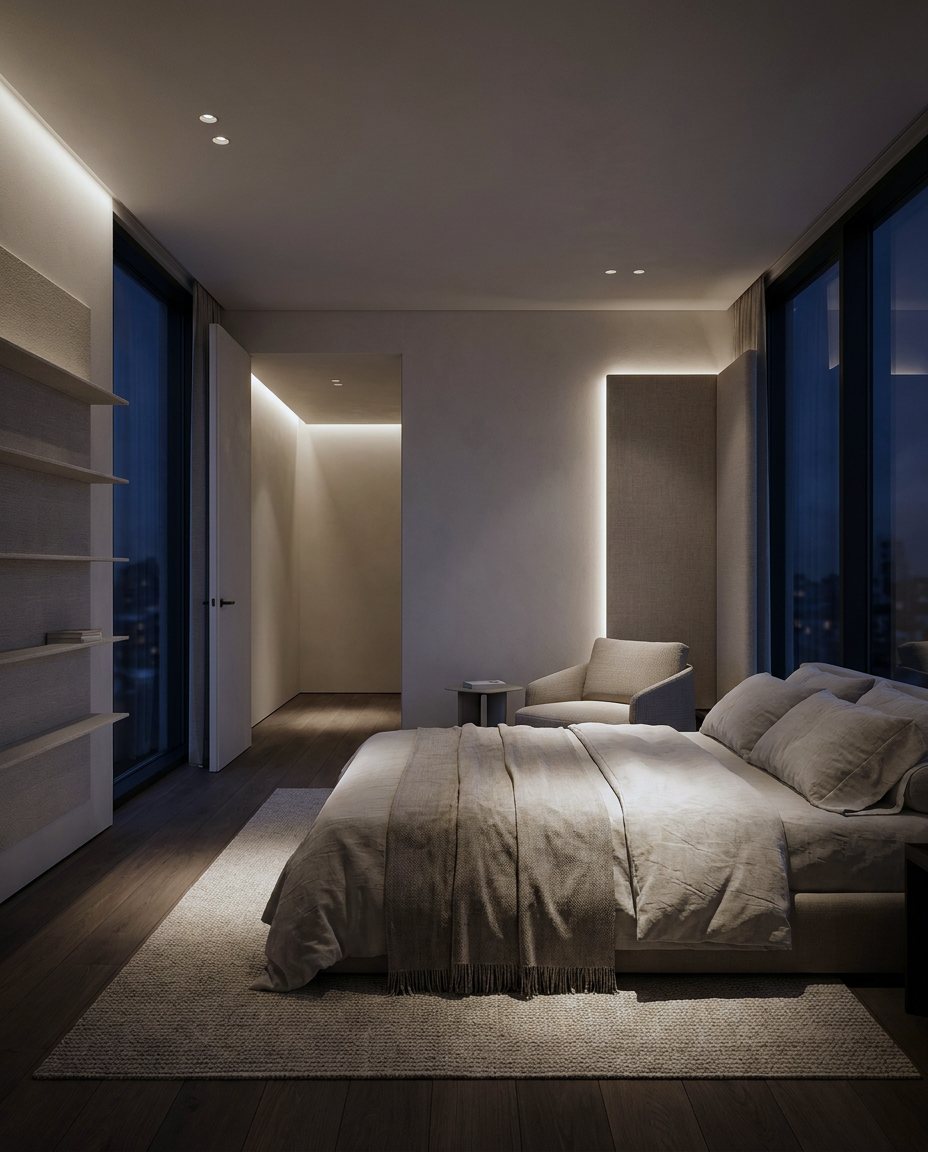
Illustrative representation, not a calibrated reproduction of actual LED light. On-screen colour depends on your display.
Illustrative comparison of ideal blackbody spectra at equal photopic illuminance. At the same illuminance, the modelled melanopic EDI is proportional to these values. They do not represent measured MINALOX luminaires; for real LEDs, a lower CCT does not automatically mean a lower value.
Melanopic sensitivity is highest at shorter visible wavelengths, around 490 nm, but it spans a broad band from violet through blue to green. Blue light is not the only contributor: the result always depends on the whole spectrum.
Light does more than help us see. Its spectral composition can also influence biological pathways involved in our daily rhythms. This is why thoughtful evening lighting considers not only colour temperature, but also spectrum, brightness and timing.913
Established factThe international framework for describing these effects is the CIE S 026 standard. It defines how the light reaching the eye is weighted for the melanopsin-containing cells of the retina (ipRGCs), which play a central role in non-visual responses to light.8
Extending the warm end of our DualWhite range to 1800 K gives designers another way to create deeply warm evening scenes. Depending on the actual light spectrum and intensity, such scenes can also support strategies aimed at reducing melanopic light exposure in the evening.
Two light sources can share one colour temperature and still differ in their melanopic content.
These five quantities describe different things and are not interchangeable.
γmel,vD65 = (Emel / Ev) / Kmel,vD65      Kmel,vD65 = 1.3262 mW/lm
Ev,melD65 = Emel / Kmel,vD65 = Ev · γmel,vD65
Calculated in your browser from the CIE S 026 melanopic action spectrum and the CIE 1931 V(λ) function at 5 nm intervals, 380–780 nm. Ideal model spectra only.1415
| Model spectrum | Melanopic DER |
|---|---|
| Blackbody 1800 K | – |
| Blackbody 2000 K | – |
| Blackbody 2700 K | – |
| Continuous spectrum, section 06 (≈ 3000 K) | – |
| Peaky spectrum, section 06 (≈ 3000 K) | – |
Published recommendation. For healthy adults, Brown et al. (2022) recommend a melanopic EDI of at least 250 lx at eye level during the day, no more than 10 lx in the evening, starting at least three hours before bedtime, and no more than 1 lx in the sleeping environment.9 These are exposure targets measured at the eye, not luminaire properties.
Not covered here. Individual differences, age (CIE S 026 provides an age-related correction), pupil size, earlier light exposure and the time course of exposure. Model spectra and screen images cannot replace measurement.
Both ranges have legitimate applications. Neither characteristic determines lighting quality on its own: the value depends on the space and how it is used. Swatches are on-screen approximations of each white point.
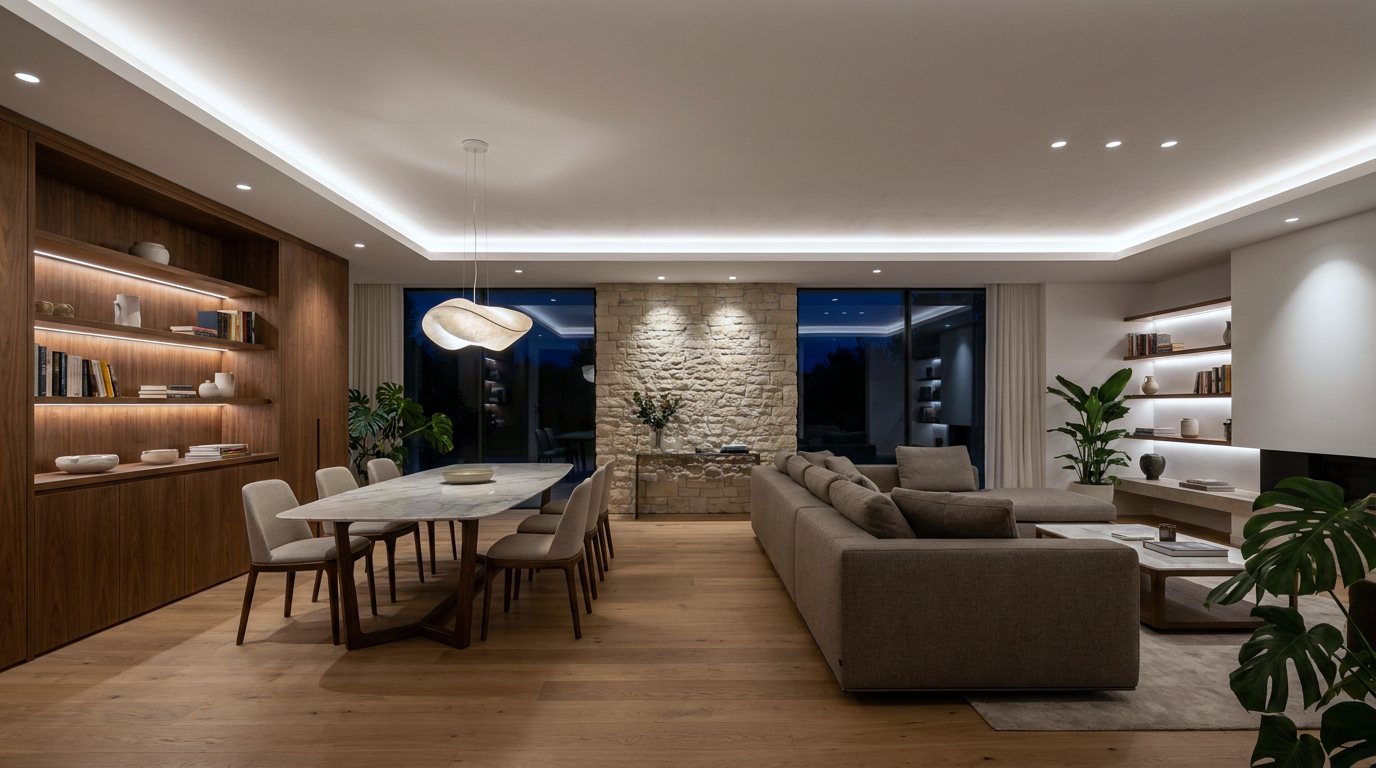
Illustrative visualisation: one AI-generated image, re-lit with a colour model of each white point at constant brightness. Real interiors also change with dimming level, spectrum and the mix of light sources.
* 6000 K is shown for comparison and lies outside the MINALOX DualWhite range. The gold mark on the slider shows 1800–4500 K.
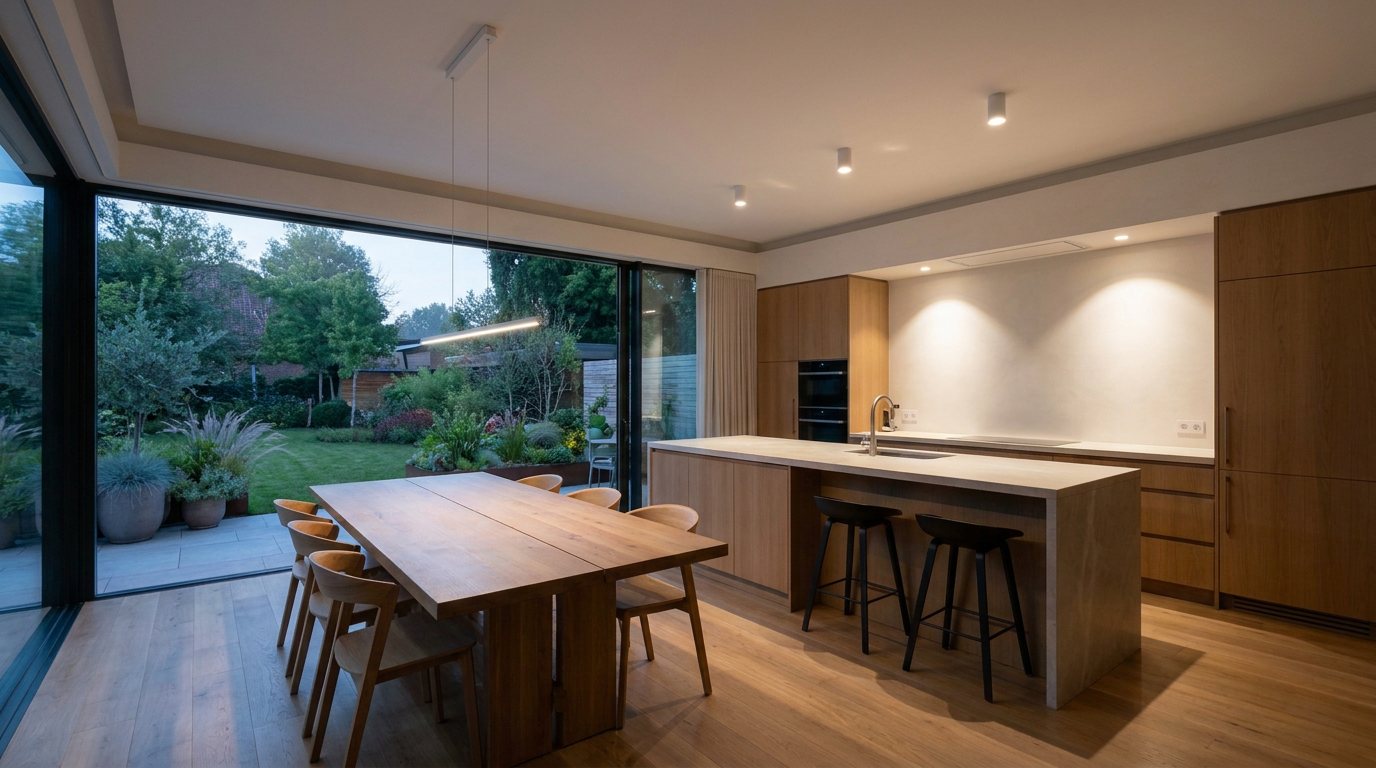
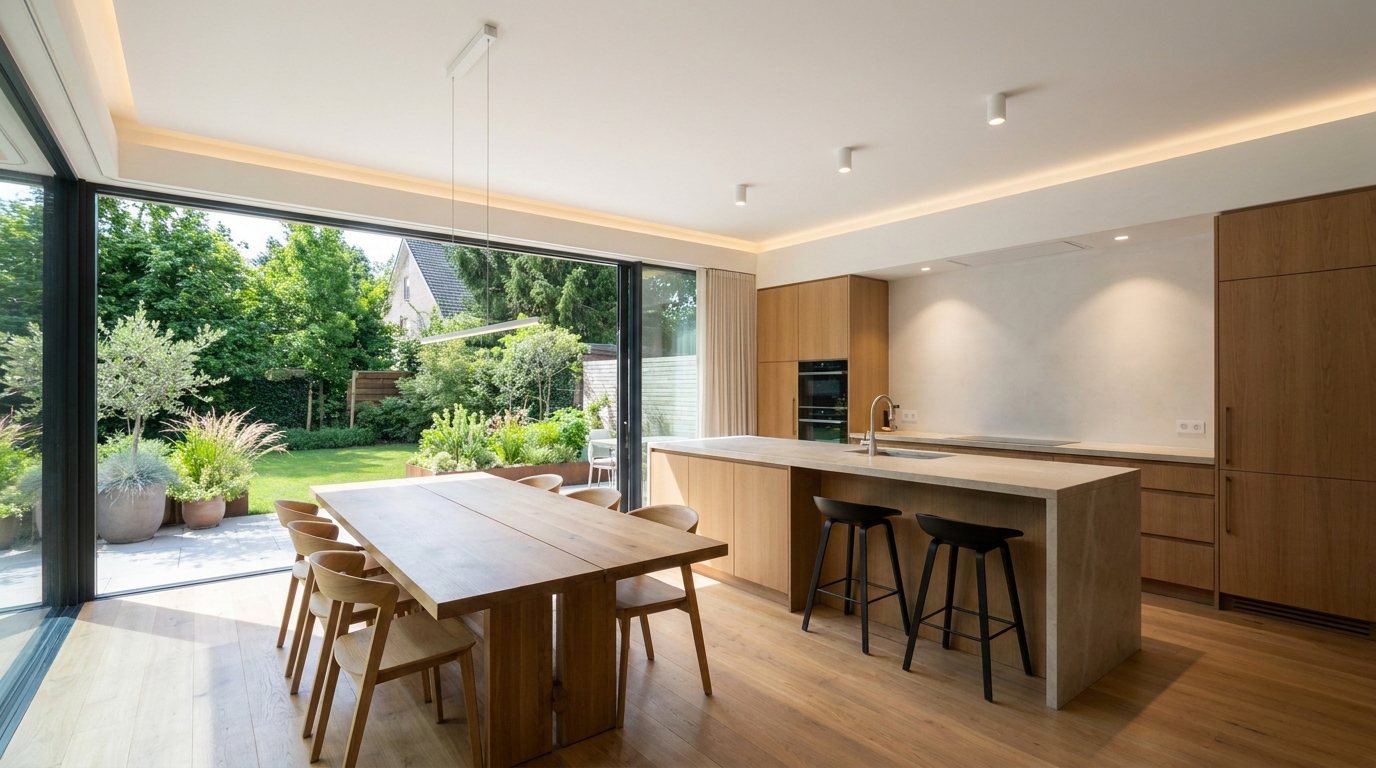
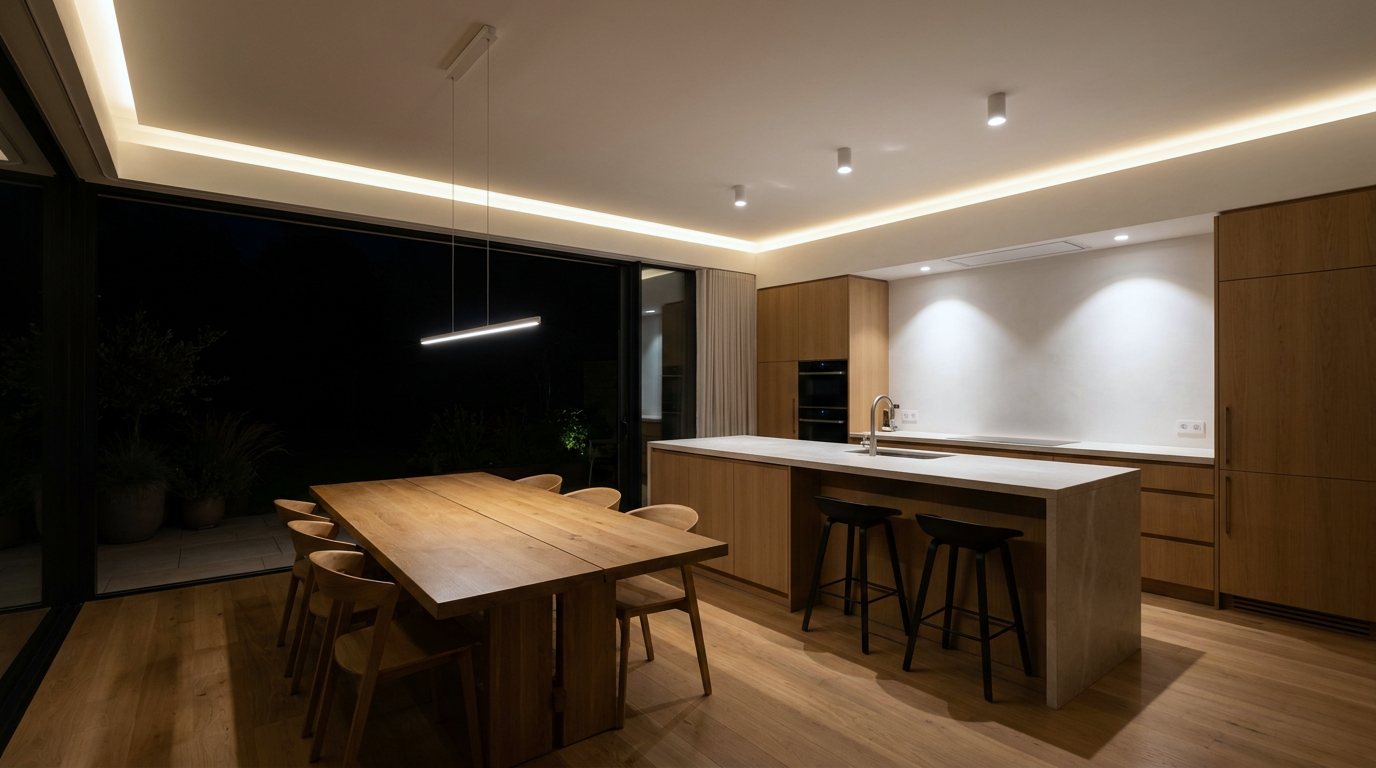
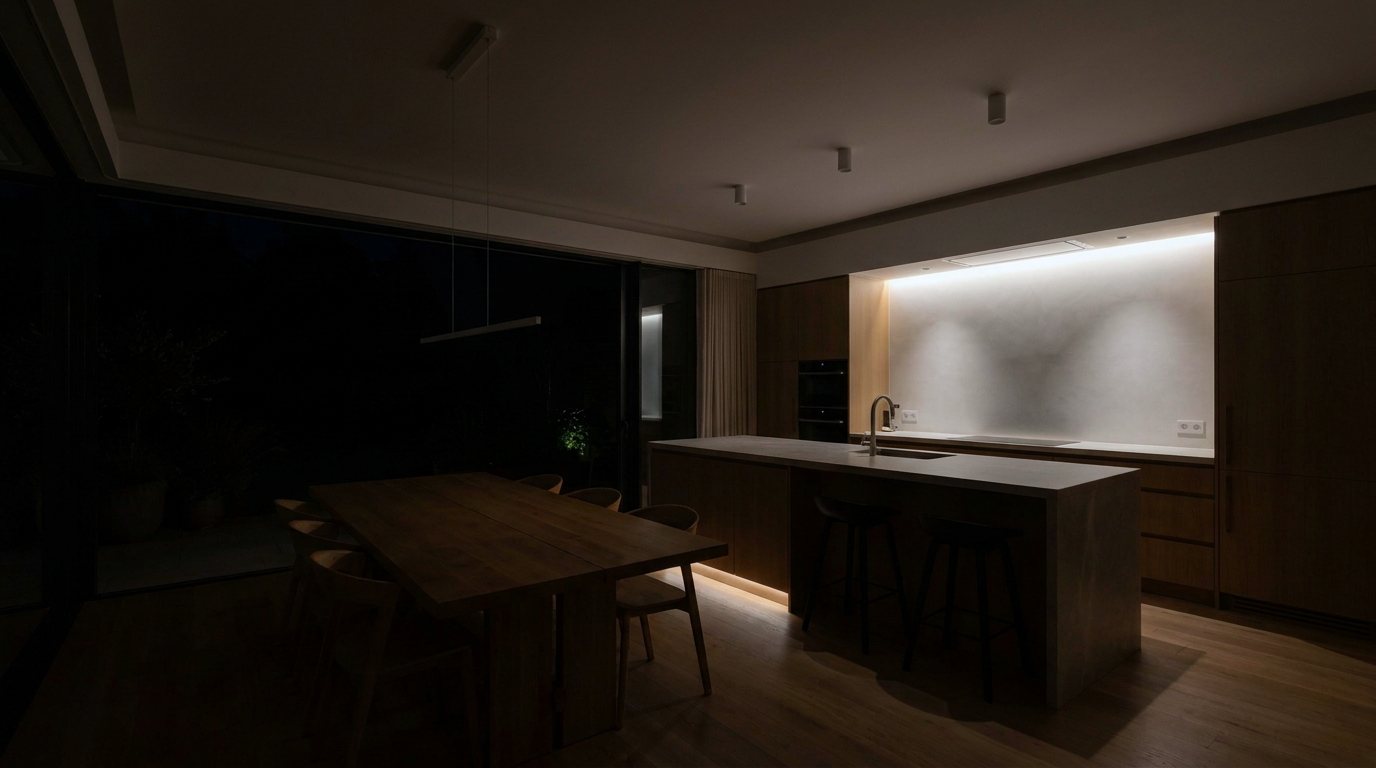
Intelligent lighting is not simply about changing colour temperature. Brightness, timing, distribution and lighting scenes matter just as much.
Example scene values for illustration; every project is planned individually. Morning and daytime images show natural daylight. How light affects people depends on its spectrum, intensity, timing and duration of exposure, not on colour temperature alone.89 All images are AI-generated illustrative visual states.
Two light sources with the same correlated colour temperature (CCT) can still look different. CCT describes the colour of the light itself, not how well that light reveals a room, its materials or the people in it.
How naturally colours and materials appear.
The wavelengths that make up the light.
How closely different luminaires match.
Where light falls and how it shapes the architecture.
Beam angles, glare control, the balance between vertical and horizontal light and the layering of sources often shape the experience of a room more than colour temperature does.
In homes, hotels and restaurants, the evening is where atmosphere matters most. A range that reaches down to 1800 K adds a deeply warm register, close to the colour of candlelight, while 4500 K keeps clear neutral-white light available for everyday tasks.
Preferred colour temperature also varies with light level, culture, task and time of day, so there is no single rule for every space.10 Settings shown are examples for illustration; every project is specified individually.
We design it around the moments that matter.
Our 1800–4500 K DualWhite standard brings together deeply warm atmospheric lighting and versatile neutral-white illumination.
It reflects our focus on architectural environments, visual comfort, intelligent control and thoughtfully designed lighting experiences.
Our portfolio has evolved towards a consistent standard that supports this approach.
Light beyond numbers.
About the visualisations. All interior images on this page are AI-generated visualisations, not photographs of MINALOX installations. Colour-temperature states are computed: the white point of each kelvin value is derived from Planck’s law and the CIE 1931 colour-matching functions (analytic approximation11), converted to sRGB and applied per channel in linear light, with partial chromatic adaptation and brightness held approximately constant. Chromaticity and melanopic values of the model spectra are calculated from tabulated CIE data;1415 their CCT is estimated with McCamy’s formula.12 Screens cannot reproduce real spectra, so all colours are approximate.
No product measurements. This page does not state measured performance values for any MINALOX product. Product data are given in the respective datasheets.